USDA Colony Loss Surveys (What the Bee Informed Partnership Data Shows)
Every spring, the number arrives. It shows up in the New York Times, the Washington Post, NPR, the wire services, and roughly a thousand agricultural publications. American beekeepers lost X percent of their colonies over the winter. The number is usually between 25 and 40 percent. The headline usually includes the word "alarming." The article usually includes a quote from a researcher saying this is "unsustainable." The comments section usually includes someone blaming Monsanto and someone else saying the bees are fine.
The number is not made up. It's derived from actual survey data collected by actual organizations with actual methodologies. But the pathway from "beekeepers reporting colony losses" to "headline number" involves a series of decisions, exclusions, and assumptions that most readers - and most journalists - don't examine. Understanding those decisions matters, because the annual loss number is the single most influential statistic in pollinator policy, and it shapes how billions of dollars in agricultural decisions get made.
The Two Surveys
Two organizations produce the colony loss data that drives US beekeeping policy and media coverage:
The USDA-NASS Honey Report
The United States Department of Agriculture's National Agricultural Statistics Service (NASS) publishes an annual Honey report that includes data on colony numbers, honey production, prices, and colony losses. The survey samples operations with 5 or more colonies - a threshold that excludes the majority of US beekeepers.
The USDA estimates there are approximately 120,000 to 130,000 beekeeping operations with 5 or more colonies in the US, managing approximately 2.5 to 2.7 million colonies. But the total number of people who keep at least one hive is estimated at 250,000 to 350,000. The 5-colony threshold means the NASS survey excludes roughly 60 to 70 percent of all US beekeepers - the hobbyists with 1 to 4 hives who represent the majority of beekeeping operations by count, though a small minority of total colonies.
The exclusion is defensible from an agricultural statistics perspective: the USDA's mission is tracking agricultural production, and operations with fewer than 5 colonies contribute negligibly to national honey production or pollination services. But from a colony health monitoring perspective, the exclusion means that the experience of the majority of beekeepers - who also tend to have the highest loss rates, because they have less experience and fewer resources for mite management - is invisible in the NASS data.
The NASS survey is mandatory for sampled operations (beekeepers selected for the sample are legally required to respond). Response rates are typically 70 to 80 percent, which is high for agricultural surveys. The data is weighted and extrapolated to estimate national totals.
The Bee Informed Partnership
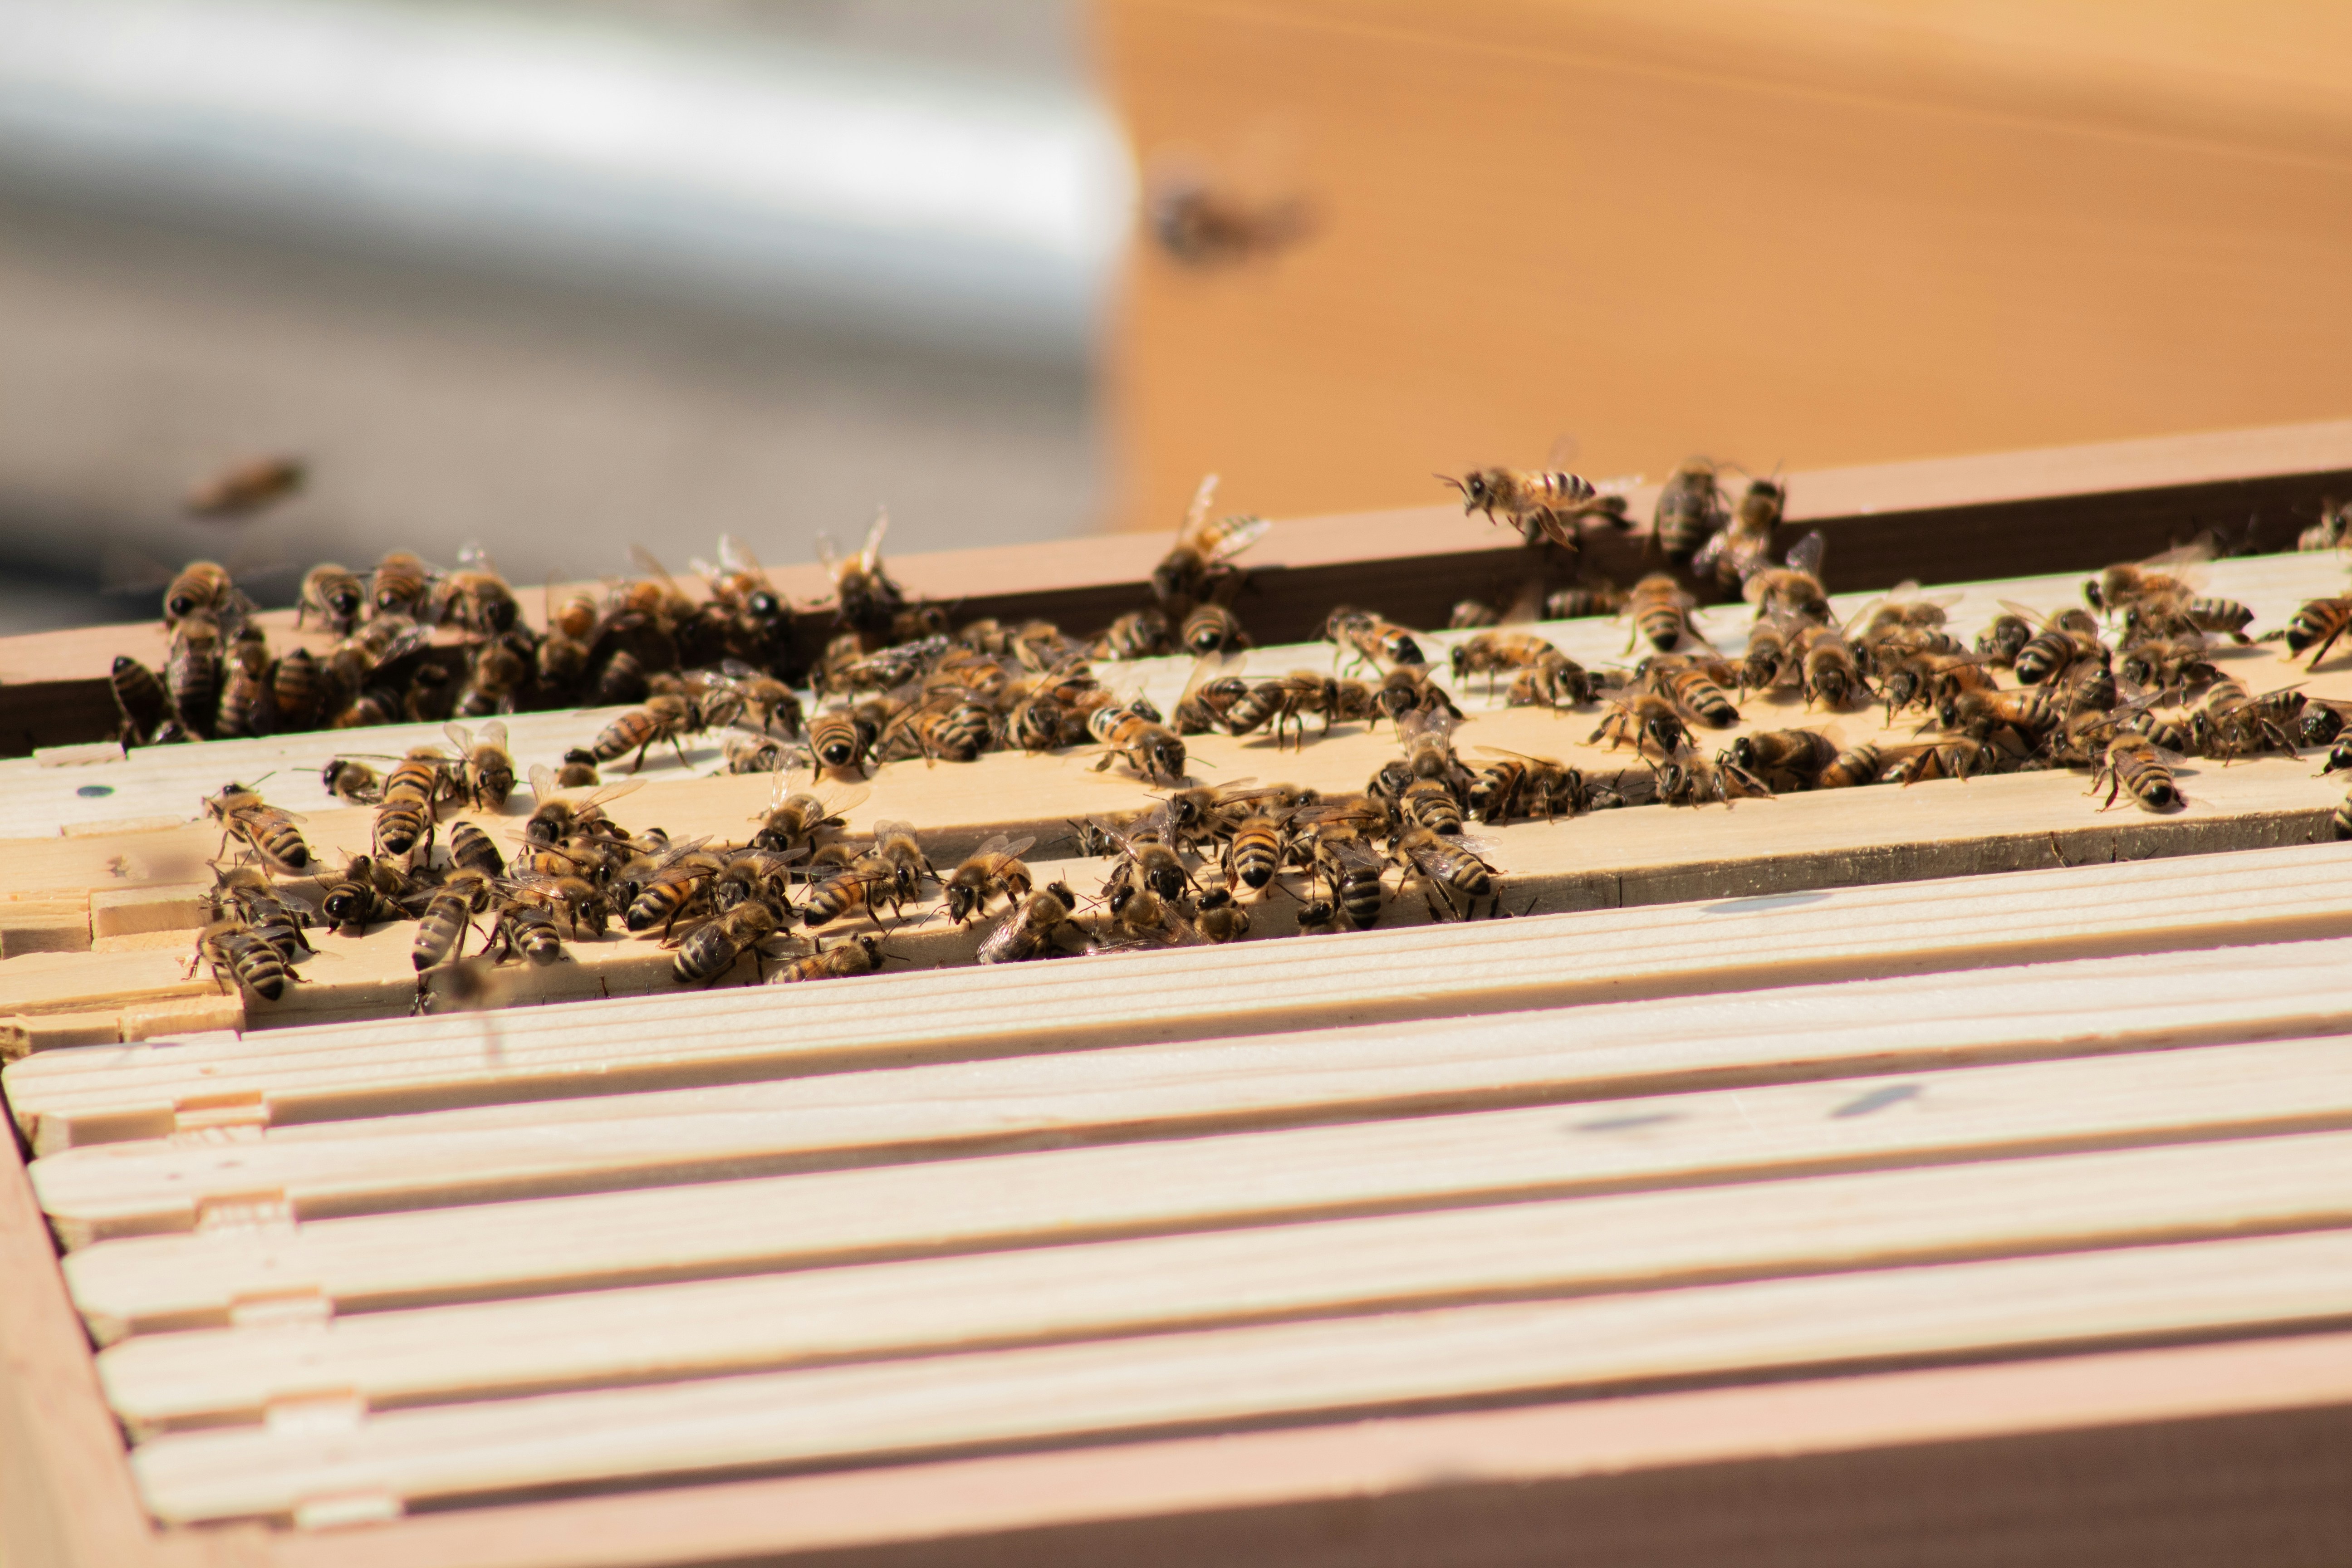
The Bee Informed Partnership (BIP) is a collaborative of university researchers, funded primarily by USDA grants, that has conducted an annual colony loss survey since 2006-2007. The BIP survey is voluntary, open to all US beekeepers regardless of operation size, and conducted online.
The BIP survey is the primary source of the "headline number" - the annual total colony loss figure that makes the news. The survey asks beekeepers to report the number of colonies they managed at the start and end of each season (summer, winter, annual), the number lost, and the perceived causes of loss.
The BIP survey reaches a substantial number of respondents - typically 3,000 to 6,000 beekeepers per year, collectively managing roughly 10 to 15 percent of US colonies. This is a good sample by survey research standards. But the sample is self-selected: beekeepers who choose to participate may differ systematically from those who don't. Researchers who study survey design note that beekeepers who have experienced losses may be more motivated to participate than beekeepers who haven't - a potential upward bias in reported loss rates. Conversely, beekeepers who have left the industry after devastating losses can't participate at all - a potential downward bias through survivorship.
The BIP publishes annual loss estimates with confidence intervals, acknowledging the survey's limitations. The estimates are consistent across years: total annual losses (April to April) have averaged 30 to 45 percent since the survey began. Winter losses (October to April) average 25 to 35 percent. Summer losses (April to October) average 20 to 25 percent.
The Apiary Project tracks every major threat to US honey bee colonies.
Explore the Issues Hub →What the Numbers Show
The consistency of the loss data over nearly two decades is itself a finding. Colony losses are not getting dramatically worse, year over year. They're not getting better. They are persistently elevated above historical baselines (pre-Varroa losses were roughly 10-15 percent annually) and have been at this elevated level since at least 2006.
The regional variation is significant. Northern states (the upper Midwest, New England, the Northern Plains) consistently report higher winter losses than southern states, reflecting the thermal stress of longer, colder winters and the longer confinement period during which colonies must survive on stored food. But summer losses are highest in the South, where year-round brood production supports year-round Varroa reproduction and pest pressure from small hive beetles is most severe.
Operation size correlates with loss rate in a counterintuitive direction: smaller operations (backyard beekeepers with fewer than 50 colonies) consistently report higher loss rates than larger commercial operations. This likely reflects the commercial beekeepers' greater experience, more aggressive mite management, and ability to split and replace colonies proactively. It also reflects the hobbyist segment's higher proportion of treatment-free beekeepers, whose colonies experience higher Varroa-driven mortality.
What the Numbers Don't Show
The headline loss number obscures several important dimensions of colony health that the surveys, by design, don't capture.
The US managed colony count has remained relatively stable (2.5 to 2.7 million) despite annual losses of 30 to 45 percent. This means beekeepers are replacing approximately 800,000 to 1.2 million colonies per year through splits, purchases, and swarm captures. The annual loss number doesn't capture this replacement effort or its cost, estimated at roughly $2 billion per year.
The alive/dead binary also conceals a spectrum of colony health. A colony that "survives" winter but emerges in spring with a failing queen, high mite load, and insufficient population to build up for pollination season is technically not a "loss" in the survey data. But it's not a productive colony either. Whether a colony can actually perform pollination services or produce honey exists on a continuum that the surveys don't measure.
Both surveys ask beekeepers to report perceived causes of loss. The top responses are consistently Varroa (or "mites and associated diseases"), queen failure, starvation, and weather. Pesticide exposure is reported as a perceived cause by approximately 5 to 10 percent of respondents. But perceived cause isn't actual cause. A beekeeper may attribute a loss to "queen failure" when the underlying cause was a Varroa-vectored virus that killed the queen. Self-reported cause attribution is one of the harder methodological problems in the field.
Sublethal damage - reduced foraging efficiency from pesticide exposure, compromised immune function from nutritional stress, impaired learning and memory from chronic chemical exposure - degrades colony performance without necessarily killing the colony. A colony that produces 40 pounds of honey instead of 80 because its foragers are impaired isn't counted as a loss, but it represents a real economic and biological deficit. The loss surveys don't see any of it.
And the surveys track managed honey bee colonies exclusively. The approximately 4,000 native bee species in the US have no equivalent monitoring infrastructure. We know more about the health of a single non-native agricultural species than we know about the combined health of the entire native pollinator fauna. Not because researchers don't care about native bees - but because monitoring 4,000 dispersed wild species is orders of magnitude harder and more expensive than surveying beekeepers about their managed colonies.
The Funding Question
The monitoring infrastructure for managed honey bee colony health - the BIP survey, the NASS report, the state apiarist inspection programs, the university research labs that analyze samples and publish findings - operates on a budget that is, by any reasonable measure, inadequate for the economic activity it supports.
The BIP's annual budget is approximately $2 to $3 million, sourced primarily from USDA competitive grants (which must be renewed every 3 to 5 years and are not guaranteed). The NASS honey survey is a standard USDA statistical program with minimal incremental cost. State apiarist programs vary from well-funded (Florida, California) to effectively nonexistent (several states have no state apiarist at all).
The total federal and state investment in honey bee colony health monitoring is probably $10 to $15 million annually. The pollination services monitored by this system are valued at $20 to $30 billion. The monitoring investment represents roughly 0.05 percent of the value at stake.
For comparison: the USDA's Animal and Plant Health Inspection Service spends approximately $1.8 billion per year on animal and plant health monitoring and enforcement. The cattle industry, valued at roughly $80 billion, receives monitoring investment equal to roughly 2 percent of its value. The beekeeping industry, supporting $20-30 billion in pollination services, receives monitoring investment equal to 0.05 percent. The disparity is not subtle.
The Colony Collapse Question
The survey infrastructure was born, in part, from Colony Collapse Disorder - the syndrome first described in 2006-2007 in which adult bees abandoned their hives, leaving behind brood, food stores, and a queen. CCD generated enormous public and media attention, and the BIP survey was launched in direct response to the need for systematic loss data.
CCD as a distinct syndrome has largely faded from the research literature. The specific abandonment behavior described in 2006-2007 is no longer widely reported. But the elevated colony loss rates that CCD brought to public attention have persisted for two decades, long after the specific syndrome stopped occurring. The losses are real. They just aren't CCD. They're the baseline of modern beekeeping in a world with Varroa, with neonicotinoids, with habitat loss, with climate change, with all the stressors operating simultaneously on every colony in every apiary.
The data infrastructure built to track CCD is now tracking something more complex and more persistent: the chronic, multifactorial colony health crisis that has no single cause, no simple solution, and no end in sight.
The Number
So when the headline says "American beekeepers lost 38 percent of their colonies last year" - what does it mean?
It means approximately 3,000 to 6,000 beekeepers voluntarily reported their losses in an online survey. The respondents are somewhat representative but not perfectly so. The loss figure is consistent with USDA data from a complementary survey with different methods and coverage. The number is real but describes only managed honey bee colonies, excludes most hobbyist beekeepers, captures only the alive/dead binary, and tells you nothing about the 4,000 wild bee species that no one is systematically counting.
The number is the best we have. It is not good enough. The economic activity it monitors - $20 to $30 billion in pollination services - deserves monitoring infrastructure comparable to what the cattle or poultry industries receive. The approximately $10 million per year currently invested in honey bee monitoring is a rounding error against the value at risk.
The bees die every year, at rates the surveys document. The surveys continue, on budgets the researchers struggle to maintain. The headlines appear, with the alarming number. The policy response remains approximately proportional to the monitoring budget: a rounding error.